https://blog.tensorflow.org/2019/09/disaster-watch-crisis-mapping-platform.html?hl=hu
https://blogger.googleusercontent.com/img/b/R29vZ2xl/AVvXsEjjO_uY0MV_-7U6hcWwGi37Z1Oek0PmMe9jtoPtCuUAnH0-6FrCTNbnKfcD4oNDv0WRr4V7mTX0v7T1vhmA6dmyuoEiEKPCBMQXrdCtBDROAJdPMEYGshvUu641W05CRzrLQg6WE2uUzDs/s1600/map.png
Disaster Watch: a crisis mapping platform to collect, evaluate, and publish disaster-related tweets
A guest post by Abraham Poorazizi, Mahmood Khordoo, and Mahsa Amini
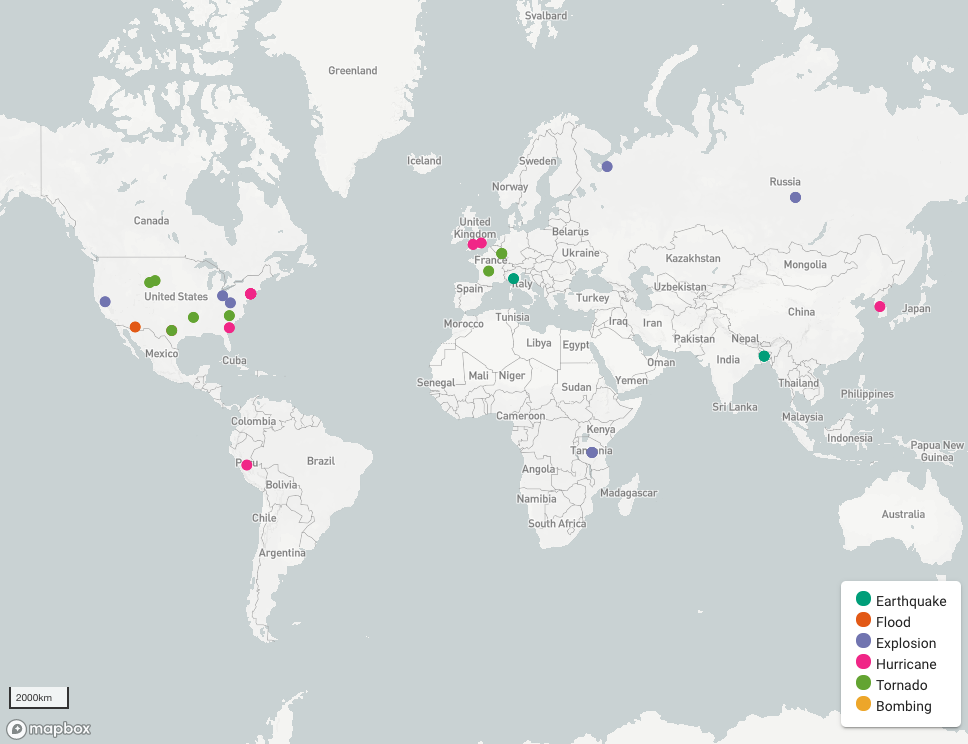 Disaster Watch
, a winning submission to the
#PoweredByTF 2.0 Challenge, is a crisis mapping platform that collects data from twitter, extracts disaster-related information from tweets, and visualizes the results on a map. It enables users to quickly locate information in different geographic areas at a glance, and to determine physical constraints caused by the disaster, such as non-accessible bridges or roads, and take an informed action. Such information helps both public officials and disaster responders (e.g., humanitarian organizations, disaster relief agencies, or local actors) answer the following questions:
- When did the disaster happen?
- Where are the affected areas?
- What are the impacts of the disaster?
The answers to these questions provide spatial (where), temporal (when), and thematic (what) information about an event. The insights gained from real-time information analysis is valuable to decision-makers throughout each phase of a disaster, from preparedness to response and recovery.
Challenges
More and more, social media is playing a key role in distributing information during disasters. People and news outlets — both affected citizens and those outside the impact zone — use social media to collate and share disaster-related information during wildfires, earthquakes, floods, and tornadoes. For example, during the 2013 Calgary flood in Alberta, Canada, people heavily used social media to post information, photos, and breaking news regarding the ongoing event. Besides citizens, Calgary’s official emergency responders, such as the Calgary Police Service and the City of Calgary, also used social media to broadcast safety-critical information and situation updates. This signifies a transition for both citizens and emergency response organizations to leverage the power of social media to spread information and awareness in real-time during an emergency.
However, there are some challenges when considering social media as an information source for disaster response. In particular, social media streams contain large amounts of irrelevant messages such as rumors, advertisements, or even misinformation. Consequently, one major challenge to using social media data such as tweets is how to process them and deliver credible and relevant information to disaster responders and citizens. Another challenge stems from the sheer amount of information that flows on social media and how to analyze it in real-time. Finally, social media messages are brief (e.g., 280 characters for tweets) and informal, which poses a challenge when applying the same methods that are used to process structured, longform texts such as news articles. These methods do not always work the same on informal, written content, and may lead to poor and misleading results.
Disaster Watch is an effort to address these problems — it aims to convert tweets into a reliable source of information and, therefore, enable an effective use of social media messages in disaster response and recovery. It uses machine learning to identify disaster-related tweets, extract place names, and map the results. The following section presents the technical architecture and describes how the system works.
Solution
Technical Architecture
Disaster Watch is built using open source software, open standards, and open data: TensorFlow 2.0, Node.js and Express, Vue.js, Vuetify, and Mapbox GL JS are used to create the system components. It collects tweets using Twitter’s streaming API, analyzes them using a deep learning model built by TensorFlow 2.0, and displays disaster-related tweets on a map. The application is hosted on Amazon’s AWS infrastructure. The figure below shows Disaster Watch’s overall architecture.
 |
| Figure 1. Disaster Watch’s overall architecture |
The workflow starts with the data collection process. The backend API uses a keyword-based sampling approach to collect tweets using Twitter’s streaming API. In this context, a reference dictionary of disaster-related terms, developed by
CrisisLex.org, was used as keywords. CrisisLex is a lexicon of 380 disaster-related terms that frequently appeared in relevant tweets during different types of disasters between October 2012 and July 2013 in the US, Canada, and Australia.
The API then sends the tweet to the deep learning model built using TensorFlow 2.0 for Python and exposed as a
Flask app. The model analyzes textual content of tweets to evaluate their relevance to floods, earthquakes, hurricanes, tornadoes, explosions, and bombings. The relevant tweets are then sent to the geoparser, which extracts place names from the text and geocodes them. Finally, the results are sent to the frontend for visualization.
Text Processing
The first step in content analysis is to train a text classifier to remove irrelevant messages prior to any further analysis. A supervised deep learning approach is used in this project to perform the text classification task. The classifier used a set of annotated tweets provided by
CrisisLex.org called “CrisisLexT6”. It contains 60,000 tweets from six different disaster categories, including floods, earthquakes, hurricanes, tornadoes, explosions, and bombings, categorized into two main groups: on-topic and off-topic. To prepare the tweets for the training process, a set of standard text preprocessing operations are performed. First, all non-words, including URLs, user mentions, punctuations, white-spaces, and special characters, are removed. Afterwards, to avoid too many variables, capital letters are changed to lowercase and the most frequent place names are removed. Next, resampling is performed to minimize class imbalance. Each tweet is then split up into tokens in the tokenization process. The vectorization process is then carried out on the remaining tokens to create a set of feature vectors using word embeddings. In the end, the feature vectors are used to train the model using Keras’s Sequential model API. For more details see the following notebooks:
Modeling,
Analysis.
Once unrelated tweets are filtered out and the on-topic ones are classified into six categories, the tweets are sent to a geoparsing tool called
CLAVIN. Geoparsing refers to the process of identifying the implicit spatial information (e.g., place names) in the text and associating them with geographical coordinates. Finally, the results, including tweet id, text, category, model’s accuracy, place name, and geographical coordinates, are sent to the client for

Conclusion
We have monitored the performance of Disaster Watch in a few real-world disasters from the recent tornadoes in the Midwestern United States to earthquakes in Japan. The results indicated that Disaster Watch was able to detect crisis-related tweets that provide timely information regarding the incident locations and impacts of the ongoing event. This highlights the thematic (semantic), temporal, and geospatial information values that social media messages can provide. It also indicates the potential of social media messages as a complementary source of information that can help citizens, decision-makers, and disaster responders to answer “where”, “when”, and “what” questions.
Disaster Watch, in its current implementation, uses Twitter as the only source of information. Although the results are promising, the integration of other sources of information, such as official news outlets and other social media platforms, would be beneficial to improve the data validation process so as to achieve more realistic results. Moreover, the current prototype only uses textual content for detecting disaster events and ignores the visual content (photos/videos). Analysis of visual content in social media messages can provide contextual information and contribute to situational awareness, as the old saying goes “a picture is worth a thousand words”. An interesting direction in this context would be the integration of image recognition services into Disaster Watch.
We encourage you to play with the web app live
here, and explore our GitHub repositories to take a deeper dive into the code base:


