https://blog.tensorflow.org/2019/09/using-tensorflow-to-predict-product.html?hl=pt_BR
https://blogger.googleusercontent.com/img/b/R29vZ2xl/AVvXsEimvGja9AcRoxBTtEqcAVVHoWTRI3gLnTY2uj4NfORlVnKbtsUxdnZje5SXi_ij7IP1pLG3JIngmKdq8WNsV9-rq9-0LtzpTinX4E96h60W3e624vg_n6E_k_hhC3QDTpTuuobWwnCcVJU/s1600/banner.jpeg
A Guest Post by Rodolfo Bonnin from the Mercado Libre Applied Machine Learning team

Introduction
Mercado Libre is the leading marketplace platform in Latin America, reaching millions of users selling and buying tens of millions of different items a day. From a shipping perspective, one of the most important pieces of information for an item is dimensions and weight since they are used for predicting costs and forecasting the occupancy of the fulfillment centers. As a user-driven marketplace, this information is not always available, and we have found that we can optimize our pipeline by predicting it in advance.
 |
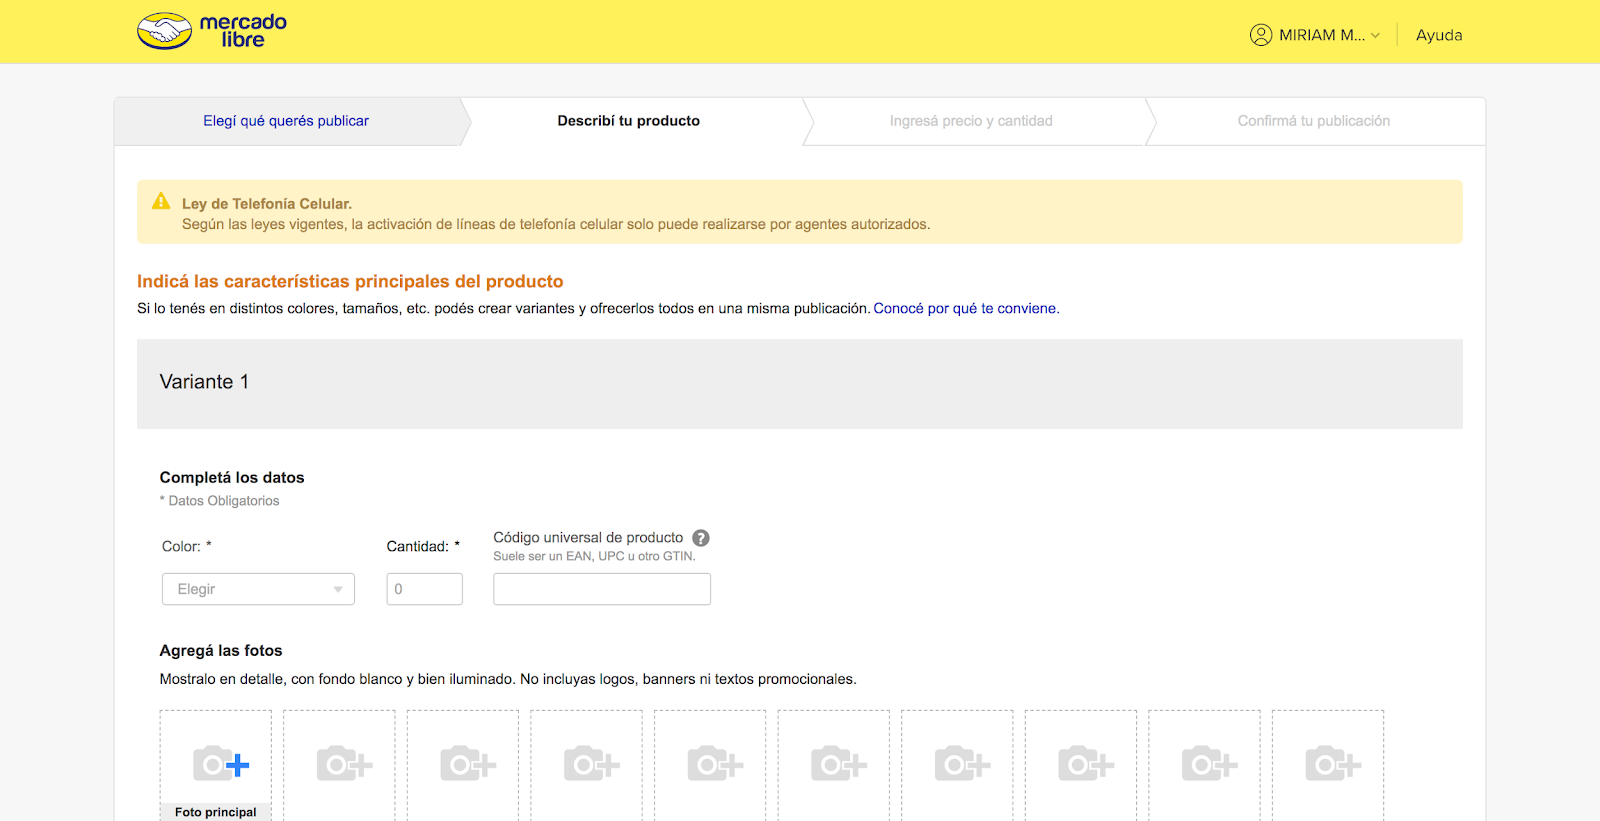
| Our initial listing submission screen does not ask for measurements or weight |
Mercado Libre is a general marketplace, so an item could be either a new cellphone (between 7 - 14 ounces, and approximately 5″ x 5″ x 2″), or a used dishwasher weighing 175 pounds and measuring 24″ x 24″ x 35″.
Initially, we implemented a lookup mechanism, which consisted of determining measure and weight based on previous measurements of the item in our fulfillment, cross-docking, and validating third party carriers, and after an outlier filtering process. Of course, this process had low coverage (the percentage of items already measured was low).
As a second measure, we built simple models based on statistical summaries of single product features, like category and brand/model, and used product similarity metrics to map new items to existing ones. These methods had poor accuracy in general, and there were a large number of cases where no prediction was possible because there weren’t adequate samples.
The need arose for a regression model, able to infer measurements from information like the item title, description, category, and a few other attributes. Importantly, these attributes include both structured and unstructured data, which are difficult to model with traditional statistical methods. The model predicts and saves 3k predictions a minute (4M a day), and the API serves (mostly pre-saved) 200k requests a minute (288M a day).
Data and features
When preparing the next iteration, after reviewing the listing publication process, we had the certainty that at least the listing title, item description (free text), along with the category and the product brand were likely to be key features for the model. Of course, the data had to be cleaned up and prepared to be useful for our project. The software stack for the ETL part of the project, was based on scipy, pandas, numpy and scikit-learn. Once we had decided on features, it was time to vectorize the data.
 |
| Composition of the model's feature union |
To encode the two main text based features, we tokenized and lower cased all the words. Next, we needed to find a suitable vector representation. For this first iteration of this project, we decided to experiment with a method using keywords and TF-idf, rather than an LSTM which we will explore in the future. TF-idf is a vectorization technique, applied to text data, which converts tokenized documents into a matrix.
The Model
The model we used was a Multi-Layer Perceptron, implemented in keras with the Tensorflow backend. Hyperparameters and architecture details were chosen by performing a grid search on learning rate, dropout, number of layers, number of kernels and kernel dimensions (we now know that random search is a much better approach).
Regarding the loss function, we tried several experiments to see which one was more appropriate:
The
mean_squared_error provided a measure that, even when heavily penalizing the errors, overshot to fit outliers.
The
mean_absolute_percentage_error preserved especially the smaller items zone from outliers (with the lower 1Kg covering 50% of the items).
The
mean_absolute_error was useful for general and broad optimization, across all item classes.
 |
| Weight error distribution for the different types of loss function |
 |
| General architecture of the neural network model |
Serving predictions
The model is currently being used in the product submission page and the fulfillment center packaging calculator, to forecast the occupancy of the shelves and the right envelope to use at the final product packaging stage.
The API currently serves 3k predictions a minute or 4M a day. The inference time for our model is 30ms and we serve it on a 64GB RAM + 6 cores instance with 13 ~900MB workers.
Here is an example Json response:
{
   “dimensions”: {
       “height”: 9,
       “length”: 30,
       “weight”: 555,
       “width”: 24
   },
   “source”: {
      “identifier”: “MLM633066627”,
      “origin”: “high_coverage”
   }
}
Moving forward, we plan to run additional experiments to optimize model quality and to refine the results based on feedback from the fulfillment center. Working with TensorFlow enabled us to rapidly design, iterate, and deploy models to production.
Acknowledgments:
- The whole Pymes Team, especially Mirko Panozzo, Conrado García Berrotarán, Kevin Clemoveki, Diego Piloni, Martín Ciruzzi and Esteban Tundidor.
- Francisco Ingham for helping with the grammar, style and contents.
- Joaquin Verdinelli for coordinating the redaction and communication with Google.
- Constanza Stahl for helping with the graphics.
- Cynthia Bustamante for general coordination help


