https://blog.tensorflow.org/2020/09/fast-supernovae-detection-using-neural-networks.html
https://blogger.googleusercontent.com/img/b/R29vZ2xl/AVvXsEiUN4BwxyDO_z9aF1X7THghaKM2-Jpjup6W7fNz1_0C6RzTK-r5sKJ-o8bFsAQRxScfIOypgXtAKf-a-JduWMnuVQFvLqs2K23e6Im79wrwVmK_rGtr2Ngz3XYmlMGMlTGsOZ7bAbK1omU/s1600/crabnebula.png
A guest post by Rodrigo Carrasco-Davis &
The ALeRCE Collaboration,
Millennium Institute of Astrophysics, Chile
Introduction
Astronomy is the study of celestial objects, such as stars, galaxies or black holes. Studying celestial objects is a bit like having a natural physics laboratory - where the most extreme processes in nature occur - and most of them cannot be reproduced here on Earth. Observing extreme events in the universe allows us to test and improve our understanding by comparing what we know about physics to what we observe in the universe.
There is a particular type of event that is very interesting for astronomers that occurs at the end of the life of massive stars. Stars are made by the concentration of hydrogen that is pulled together by gravity, and when the density is high enough, the fusion of hydrogen atoms begins, generating light and creating elements such as helium, carbon, oxygen, neon, etc. The fusion process generates an outwards pressure while gravity causes an inward pressure, maintaining the star stable while it’s burning its fuel. This changes when the star tries to fuse iron atoms, which instead of generating energy must extract energy from the star, causing the core of the star to collapse and a supernova explosion to happen.
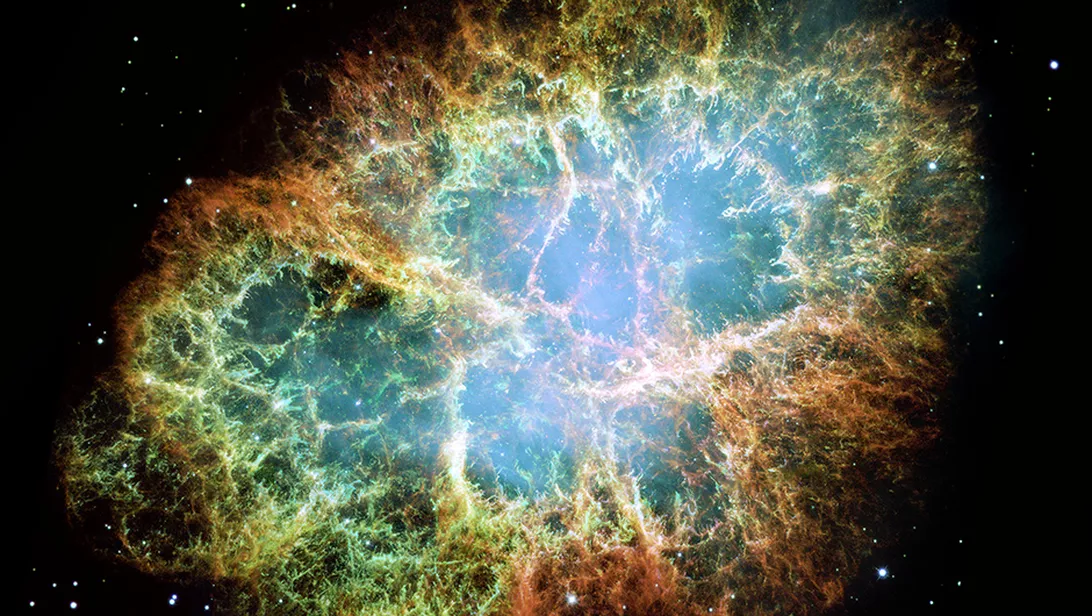 |
| Crab Nebula, remnant of a supernova. Space Telescope Science Institute/NASA/ESA/J. Hester/A. Loll (Arizona State University). This image is from hubblesite.org. |
This process is very important for astronomers. Due to the extreme conditions during the explosion, astronomers can observe the synthesis of heavy elements, test the behavior of matter under intense pressure and temperature, and also observe the product of the explosion, which could be a neutron star or a black hole.
Supernovae can also be used as standard candles. A typical problem in astronomy is measuring distances to celestial objects. Because stars are very far from the Earth, it is difficult to know if a star is faint and close to us, or it is far away and very bright. Most of the supernova explosions in the universe occur in a similar fashion; therefore, astronomers use supernovae to measure distances, which is important for cosmologists to study, for instance, the expansion of the universe and dark energy.
Even though supernova explosion are very bright (compared to the brightness of their own host galaxy), these events are hard to find due to their distance to the Earth, due to their low occurrence rates (roughly one supernova per galaxy per century), and the transient nature of the explosion, which could last from a few days to a couple of weeks. Also, to obtain useful information from a supernova, it is necessary to perform follow-up, this is observing the supernova with an instrument called spectrograph, to measure the energy emitted during the explosion at multiple frequencies. Early follow-up is desired because many of the interesting physical processes occur within a few hours from the beginning of the explosion. So how can we find these supernova explosions fast, among all the other observed astronomical objects in the universe?
Astronomy Today
A few decades ago, the astronomer had to choose and point to a specific object in the sky to study them. Now, modern telescopes such as
The Zwicky Transient Facility (ZTF), which is currently operating, or
The Vera C. Rubin Observatory, will take large images of the sky at a very high rate, observing the visible sky every three days, creating a movie of the southern hemisphere sky. Today, the ZTF telescope generates 1.4TB of data per night, identifying and sending information about interesting changing objects in the sky in real-time.
When something changes its brightness, these telescopes are able to detect the changes and generate an alert. These alerts are sent through a data stream, where each alert is composed of three cropped images of 63 by 63 pixels. These three images are called science, reference and difference image. The science image is the most recent observation of that particular location, the template is usually taken at the beginning of the survey and it is used to compare it against the science image. Everything that changed between science and template should appear in the difference image, which is computed by subtracting the reference to the science image after some image processing. The ZTF telescope is currently streaming up to one million alerts per night, ten hundred thousand on average. Let’s say a human wants to check each alert manually, then if it takes 3 seconds to inspect each alert, in a regular night,
it would take approximately 3.5 days to see all of the alerts of a single night.
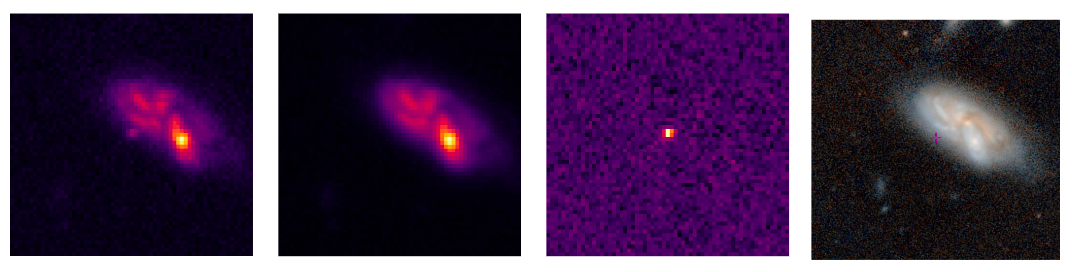 |
| Science, reference and difference image from left to right. These three images, plus extra important data such as observation conditions and information about the object. The fourth image is a colored version from PanSTARRS using Aladin Sky Atlas. You can see the full evolution of brightness in time of the supernova in the ALeRCE frontend. |
Organizing all the incoming alerts in the stream is a massive task. When a new alert arrives, the type of astronomical objects that generated the alert is not necessarily known. Therefore, we need to check if we already know this object from other observations (cross-match). We also need to figure out which kind of astronomical object generated the alert (classification), and lastly, we need to organize the data and make it available to the community. This is the duty of astronomical broker systems, such as
ALeRCE,
Lasair,
Antares.
Since these alerts are basically everything that changes in the sky, we should be able to find supernovae among all the alerts sent by the ZTF telescope. The problem is that other astronomical objects also produce alerts, such as stars that change their brightness (variable stars), active galactic nuclei (AGNs), asteroids and errors in the measurement (bogus alerts). Fortunately, there are some distinguishable features in the science, reference and difference images that could help us to identify which alert is supernovae, or other objects. We would like to effectively discriminate among these five classes of objects.
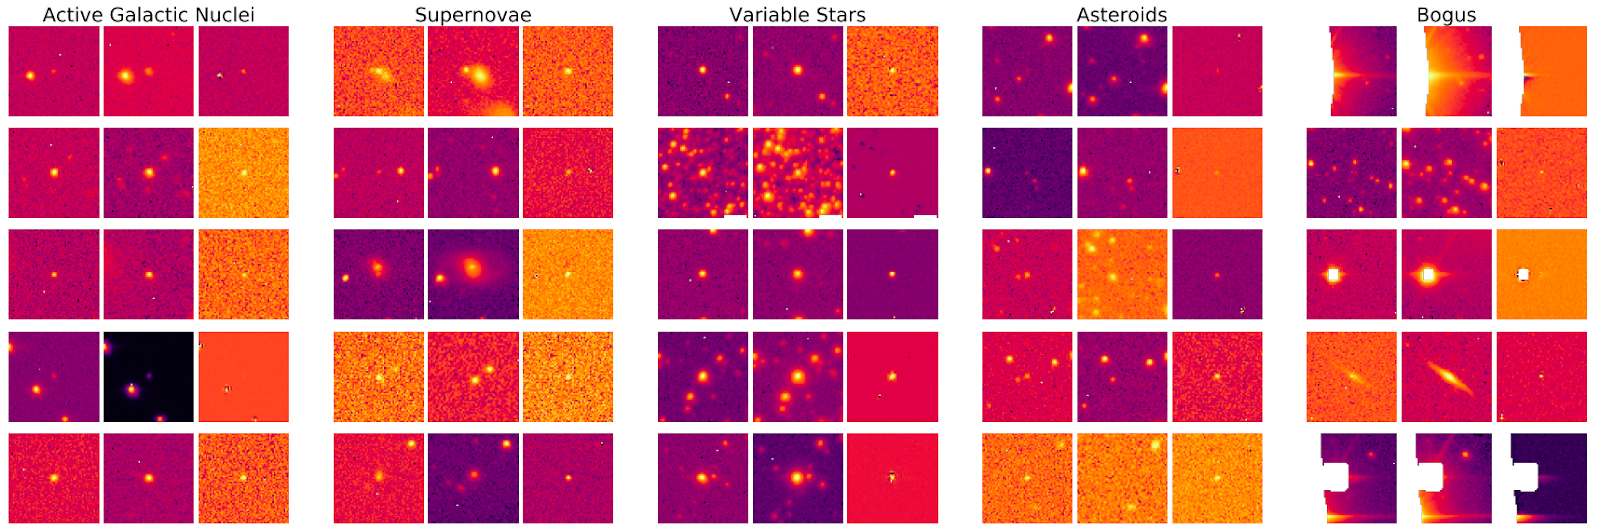 |
| Five classes of astronomical objects that can be separated using only the first alert. These are five examples per class, with science, reference and difference image respectively. |
In summary, active galactic nuclei tend to occur at the center of galaxies. Supernovae occur usually close to a host galaxy. Asteroids are observed near the solar system plane, and they do not appear in the template image. Variable stars are found in images crowded with other stars since these are found mostly within the Milky Way. Bogus alerts have different causes, some of them are bad pixels in the camera, bad subtraction to generate the difference image, cosmic rays (very bright, concentrated and sharp regions of the image in the center of the alert), etc. As I mentioned before, there is no way a human could possibly check every alert by hand, so we need an automatic way to classify them so astronomers can check the most interesting sources that are more likely to be a supernova.
Finding Supernovae using Neural Networks
Since we roughly understand the differences between images among the five mentioned classes, in principle we could compute specific features to correctly classify them. However, handcrafting features are usually very hard and it takes a long period of trial and error. This is why we decided to train a convolutional neural network (CNN) to solve the classification problem (
Carrasco-Davis et al. 2020). In this work, we used the first alert only to quickly find supernovae.
Our architecture provides rotational invariance by making 90° rotated copies of each image in the training set, to then apply average pooling to the dense representation of each rotated version of the image. Imposing rotational invariance in this problem is very helpful, since there is no particular orientation in which structures may appear in the images of the alert (
Cabrera-Vives et al. 2017,
E. Reyes et al. 2018). We also added part of the metadata contained in the alert, such as the position in sky coordinates, distance to other known objects, and atmospheric condition metrics. After training the model using cross-entropy, the probabilities were highly concentrated around values of 0 or 1, even in cases when the classifier was wrong in its predicted class. This is not so convenient when an expert further filters supernovae candidates after the model made a prediction. Saturated values of 0 or 1 do not give any insight about the chances of a wrong classification and second or third class guess made by the model.
Therefore, in addition to the cross-entropy term in the loss function, we added an extra to maximize the entropy of the prediction, in order to spread the values of the output probabilities (
Pereyra et al. 2017). This improves the granularity or definition of predictions, obtaining probabilities in the whole range from 0 to 1 instead of being concentrated, producing much more interpretable predictions to assist the astronomer to choose good supernovae candidates to report for follow-up.
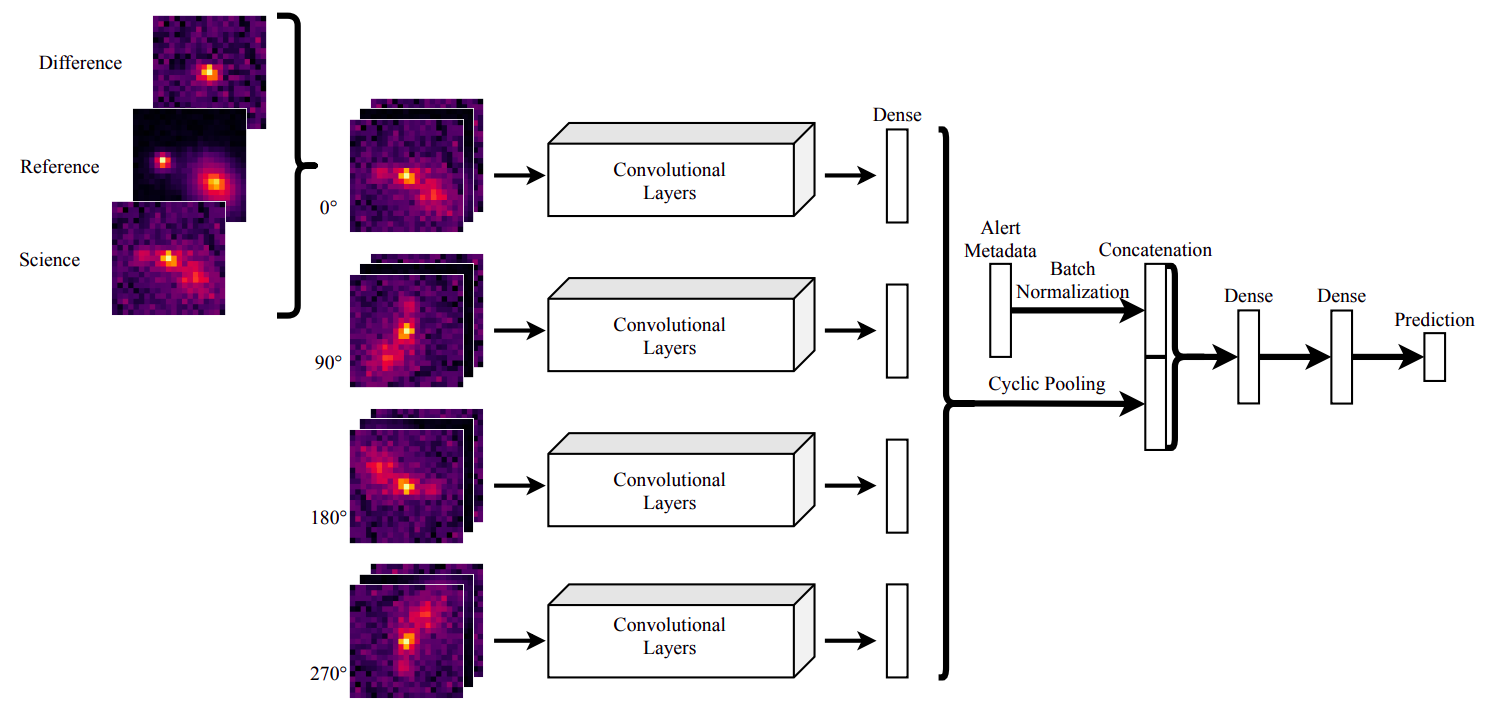 |
| Convolutional neural network with enhanced rotational invariance. Rotated copies for each input are created and fed to the same CNN architecture, to then apply average pooling in the dense layer before concatenating with the metadata. Finally, two other fully connected layers, and a softmax are applied to obtain the predictions. |
We performed inference on 400,000 objects uniformly distributed in space over the full coverage of ZTF, as a sanity check of the model predictions. It turns out that each predicted class by the CNN is spatially distributed as expected given the nature of each astronomical object. For instance, AGNs and supernovae (SNe) are mostly found outside the Milky Way plane (extragalactic objects), since it is less likely that further objects can be seen through the Milky Way plane due to occlusion. The model correctly predicts less number of objects close to the Milky Way plane (Galactic latitudes closer to 0). Variable stars are correctly found with higher density within the Galactic plane. Asteroids are found near the solar system plane, also called the ecliptic (marked as a yellow line) as expected and bogus alerts are spread everywhere. Running inference in a large unlabeled set gave us very important clues regarding biases in our training set and helped us to identify important metadata used by the CNN.
We found that the information within the images (science, reference and difference) is enough to obtain a good classification in the training set, but integrating the information from the metadata was critical to obtain the right spatial distribution of the predictions.
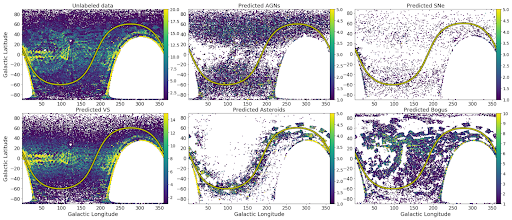 |
| Spatial distribution of unlabeled set of astronomical objects. Each plot is in galactic coordinates. The galactic latitude is centered in the Milky Way, so latitudes closer to 0 are also closer to the Milky Way plane. The galactic longitude indicates which part of the disk we are seeing within the Milky Way plane. The yellow line represents the solar system plane (ecliptic). |
Supernova Hunter
A vital part of this project is the web interface that allows astronomers to explore the candidates sorted by our neural network model certainty of being a supernova. The
Supernova Hunter is a visualization tool that shows important information about the alert so the astronomer chooses which objects should report as supernovae. It also has a button to report wrong classifications made by our model, so we can add it to the training set to later improve the model using these examples labeled by hand.
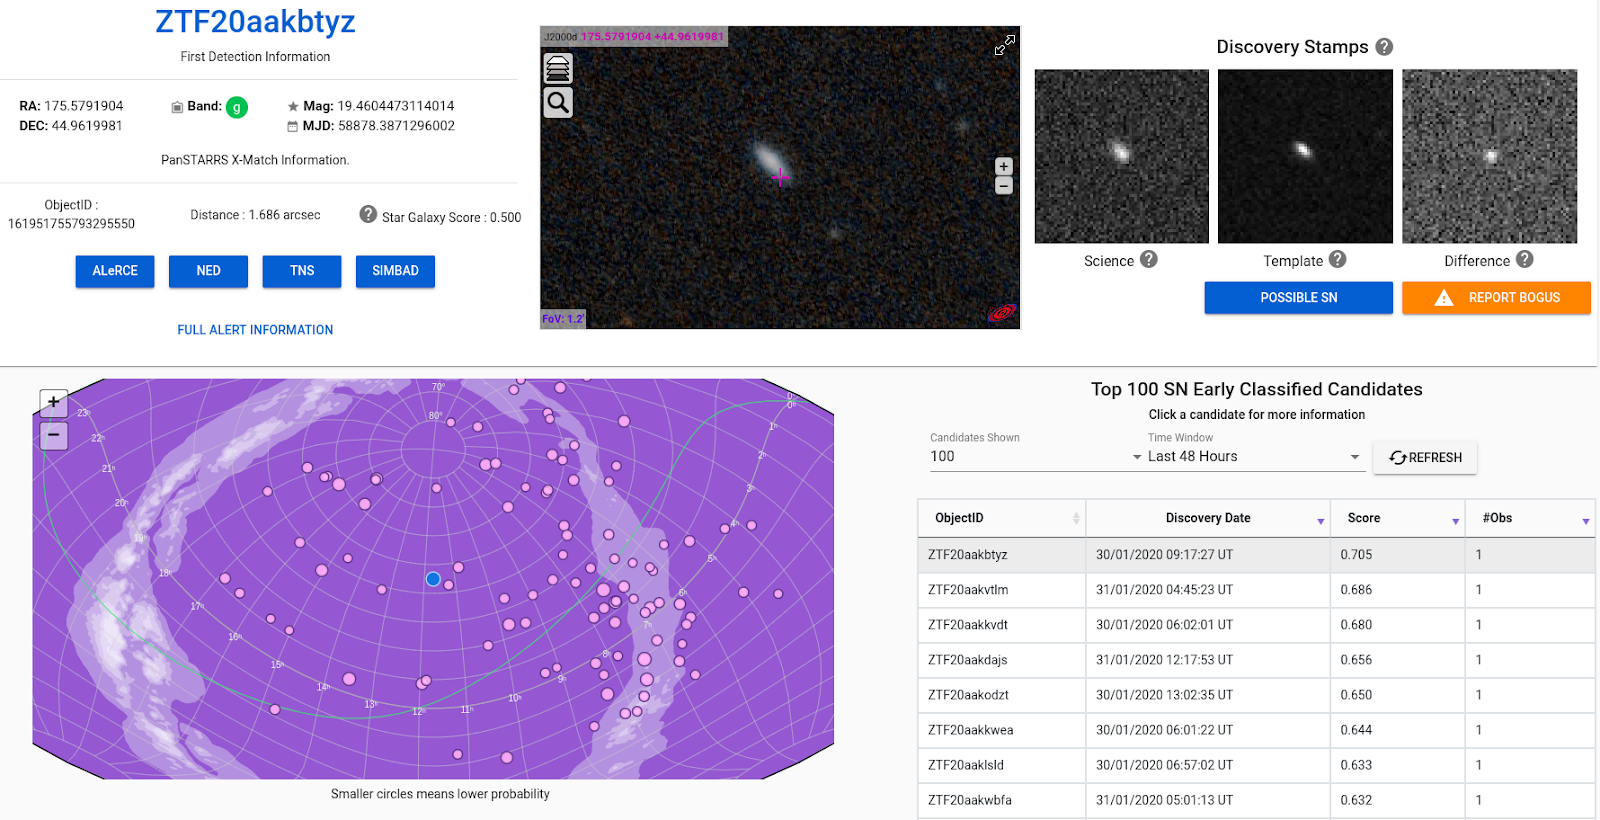 |
| Supernova Hunter: User interface for exploration of supernovae candidates. It shows a list with the alerts with a high probability of being a supernova. For each alert, the images of the alert, the position of the object and metadata are displayed on the web page. |
Using the neural network classifier and the Supernova Hunter, we have been able to confirm 394 supernovae spectroscopically, and report 3060 supernovae candidates to the
Transient Name Server, from June 26, 2019 to July 21, 2020 at a rate of 9.2 supernova candidates reported per day. This rate of discovery of supernovae is drastically increasing the amount of available supernovae in early stages of the explosion.
The Future
We are currently working on improving the classification performance of our model to have better supernova candidates and less expert assistants to report them. Ideally, we would like to have a system that is good enough to automatically report each possible supernova candidate with high confidence.
We would also like to extend our model so it can
use more than a single stamp. We developed a neural network model that is able to receive a sequence of images instead of a single stamp, so every time a new image is available for a specific object, the model is able to integrate the new arriving information so it can improve the certainty of its prediction for each class.
Another key point of our effort is focused on finding rare objects using outlier detection techniques. This is a crucial task since these new telescopes will possibly reveal new kinds of astronomical objects due to the unprecedented sampling rate and the spatial depth of each observation.
We think this new way of analyzing massive amounts of astronomical data will be not only helpful but necessary. The organization, classification and redistribution of the data for the scientific community is an important part of doing science with astronomical data. This task requires expertise from different fields, such as computer science, astronomy, engineering and mathematics. The construction of new modern telescopes such as The Vera C. Rubin Observatory will drastically change the way astronomers study celestial objects, and as the ALeRCE broker we will be ready to make this possible. For more information, please visit
our website, or take a look at our papers:
ALeRCE presentation paper which describes the complete processing pipeline, the
stamp classifier (the work described in this blogpost), and the
light curve classifier, which provides a more complex classification with a larger taxonomy of classes by using the a time series called light curve.


